A data explorer and visualizer built off the NYC Open Data portal.
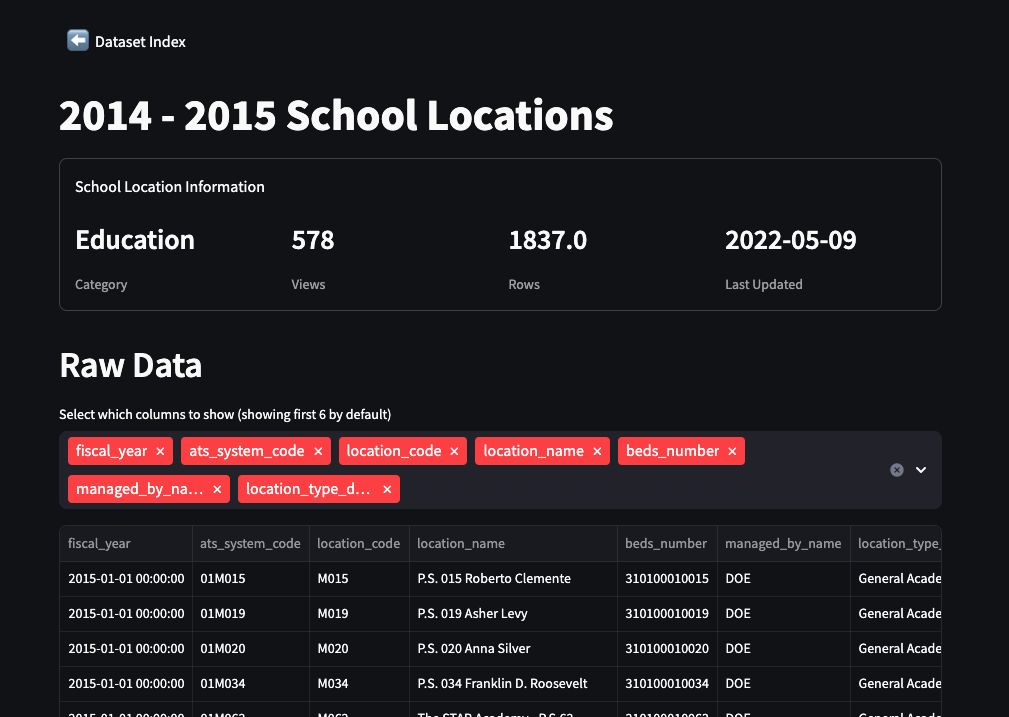
NYC Open Data is an expansive portal of over 3000 datasets, files, maps, and more. I built a portal to quickly search, sort, and skim the datasets, and open them up for basic exploration.
This project is a little bit unique in that my goal was not do dive deeply into a specific dataset, rather it was to cleanly and intelligently display any of the datasets.
To start, I had to scrape the metadata from all 3000+ datasets. After first using Playwright to render the javascript, I found a method that didn’t require javascript, and instead parse the text with regular expressions.
I chose Streamlit as the visualization package, largely because it looked cool and feature-rich.
For the viewer page, I wanted the page to be able to detect columns that were latitude and longitude, since the datasets do not have consistent column names. With those columns detected, I could map any datasets that contained a lat+long.
There are many features that I’d still like to add, especially around the handling of other types of datasets, such as “map”, which is sometimes geojson and sometimes csv, and thus a bit more complex to process.
Project requirements:
- Scrape meta-data from datasets
- View, display, and sort meta-data
- Viewer to load and display dataset data
- Automatic recogniction of lat/long columns, conversion to numeric formats, and display on map.
Tools:
- Scrapy
- Streamlit
- Python (pandas, requests)
link: https://nycopendataexplorer.streamlit.app/
